最近项目需要显示统计数据。
所以就选择一款合适爱用的插件来展示数据。
好像有名的的就那么几个:
看网址就知道 前俩是 专业的 (顶级域名 ^_^),最终选择的是用 Chart.js。
优点就是 小巧、 尺寸可以自适应,可以直接 在 CSS 里面定义尺寸,不用 JS 去定义。
食用步骤:
1 定义 HTML
<canvas id="demo" width="500" height="300"></canvas>
2 调用 JS
new Chart(document.querySelector("#demo"), {
    type: 'line',
    data: {
        labels: [ // 24 小时 X 轴
            '00','01','02','03','04','05','06','07','08','09','10','11','12','13','14','15','16','17','18','19','20','21','22','23'
        ],
        datasets: [
            {
                fill: false,
                label: '访问量',
                borderColor: '#f39c12',
                backgroundColor: '#f39c12',
                key: 'num',
                color: '#f39c12',
                data: [ // Y 轴 数据 1
                    360,307,90,45,50,37,66,415,927,1181,1131,939,1238,612,979,845,1159,1104,568,382,503,386,493,813
                ]
            },
            {
                fill: false,
                label: 'IP 数',
                borderColor: '#00a65a',
                backgroundColor: '#00a65a',
                key: 'ip',
                color: '#00a65a',
                data: [ // Y 轴 数据 2
                    78,31,29,26,18,32,31,87,133,162,164,145,133,124,169,173,173,174,144,133,125,121,125,114
                ]
            }
        ]
    },
    options: {
        responsive: false,
        title: {
            display: true,
            text: '最近 24 小时分布'
        },
        tooltips: {
            position: 'average',
            mode: 'index',
            intersect: false,
            backgroundColor: 'rgba(0,0,0,.4)'
        }
    }
});
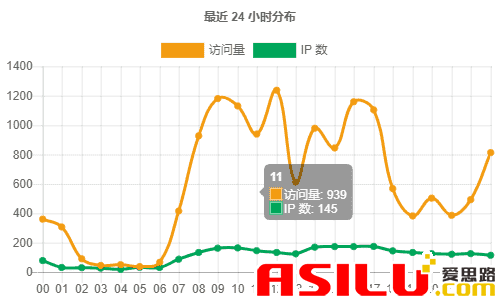
3 输出效果

数据查询出来的数据格式
[
	{hour: "00", num: 7584, ip: 838},
	{hour: "01", num: 4550, ip: 527},
	// ....
]
上面调用的代码部分与源数据不一致,一个图表还没什么,多了就感觉不爽了
所以就有下面的代码
/**
 * 格式化数据 返回 Chart 需要的配置信息
**/
/*
conf: {
    title: '标题',
    label: 'label key', // 必须
    responsive: false, // 同 options.responsive
    items: [ // 数据字段信息 必须
        {
            key: '数据字段 key', // 必须
            label: '名称',
            color: '颜色',
            // ...  更多同 data.datasets
        }
    ],
    options: {
        // 同 options
    }
}

reverse: 倒序
*/
function ChartDataParse(list, conf, reverse){
    if(typeof list != 'object' || typeof conf != 'object'){
        return null;
    }
    if(reverse){
        list.reverse();
    }

    var data = [], label = [], _i = {}, _num = 0;

    for(k in list){
        var a = list[k];
        conf.items.forEach(function(item){
            if(typeof _i[item.key] == 'undefined'){
                _i[item.key] = _num++;
                data[_i[item.key]] = {
                    fill: false,
                    label: item.label || item.key
                };
                if(item.color){
                    data[_i[item.key]].borderColor = item.color;
                    data[_i[item.key]].backgroundColor = item.color;
                }
                for(k in item){
                    data[_i[item.key]][k] = item[k];
                }
                data[_i[item.key]].data = [];
            }
            if(typeof a[item.key] != 'undefined'){
                data[_i[item.key]].data.push(a[item.key]);
            }
        });
        if(typeof a[conf.label] != 'undefined'){
            label.push(a[conf.label]);
        }
    }

    var ChartConfig = {
        type: conf.type || 'line',
        data: {
            labels: label,
            datasets: data
        },
        options: {
            responsive: false,
            title: {
                display: !!conf.title,
                text: conf.title || false
            },
            tooltips: {
                position: 'average', // average nearest
                mode: 'index',
                intersect: false,
                backgroundColor: 'rgba(0,0,0,.4)'
            },
        }
    };
    if(typeof conf.options == 'object'){
        for(k in conf.options){
            ChartConfig.options[k] = conf.options[k];
        }
    }
    if(typeof conf.title != 'undefined'){
        ChartConfig.options.title.text = conf.title;
    }
    if(typeof conf.responsive != 'undefined'){
        ChartConfig.options.responsive = conf.responsive;
    }
    return ChartConfig;
}
以后调用起来就简单多了
new Chart(document.querySelector("#demo"), ChartDataParse(data/* 源数据格式
[
	{hour: "00", num: 7584, ip: 838},
	{hour: "01", num: 4550, ip: 527},
	// ....
]
 */, {
	label: 'hour', // X  轴 对应的 KEY
	type: 'line',
	title: '最近 24 小时分布',
	items: [{
		key: 'num',
		label: '访问量',
		color: '#f39c12'
	},{
		key: 'ip',
		label: 'IP 数',
		color: '#00a65a'
	}]
}, 1);
这样以后就可愉快的玩耍了
